Control State Representations
There are at least two ways to represent the state of a control process at a particular point in time:
- Visual
- Tabular
Visual Representation of the Control State
The control state can be represented in form of a Petri net with the token showing the sub-processes and activities that are currently being executed.
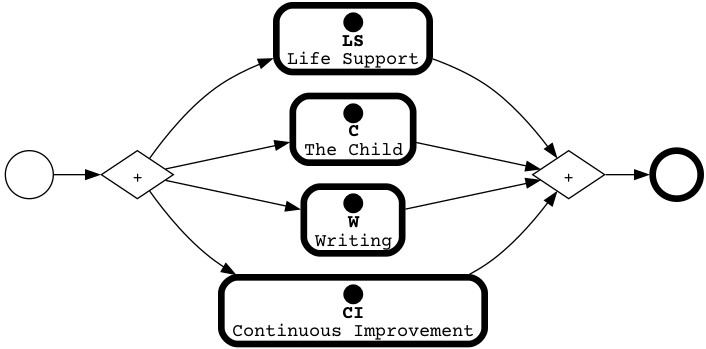
The above diagram states that the control processes Life Support, The Child, Writing, and Continuous Improvement are currently being executed.
Tabular Representation of the Control State
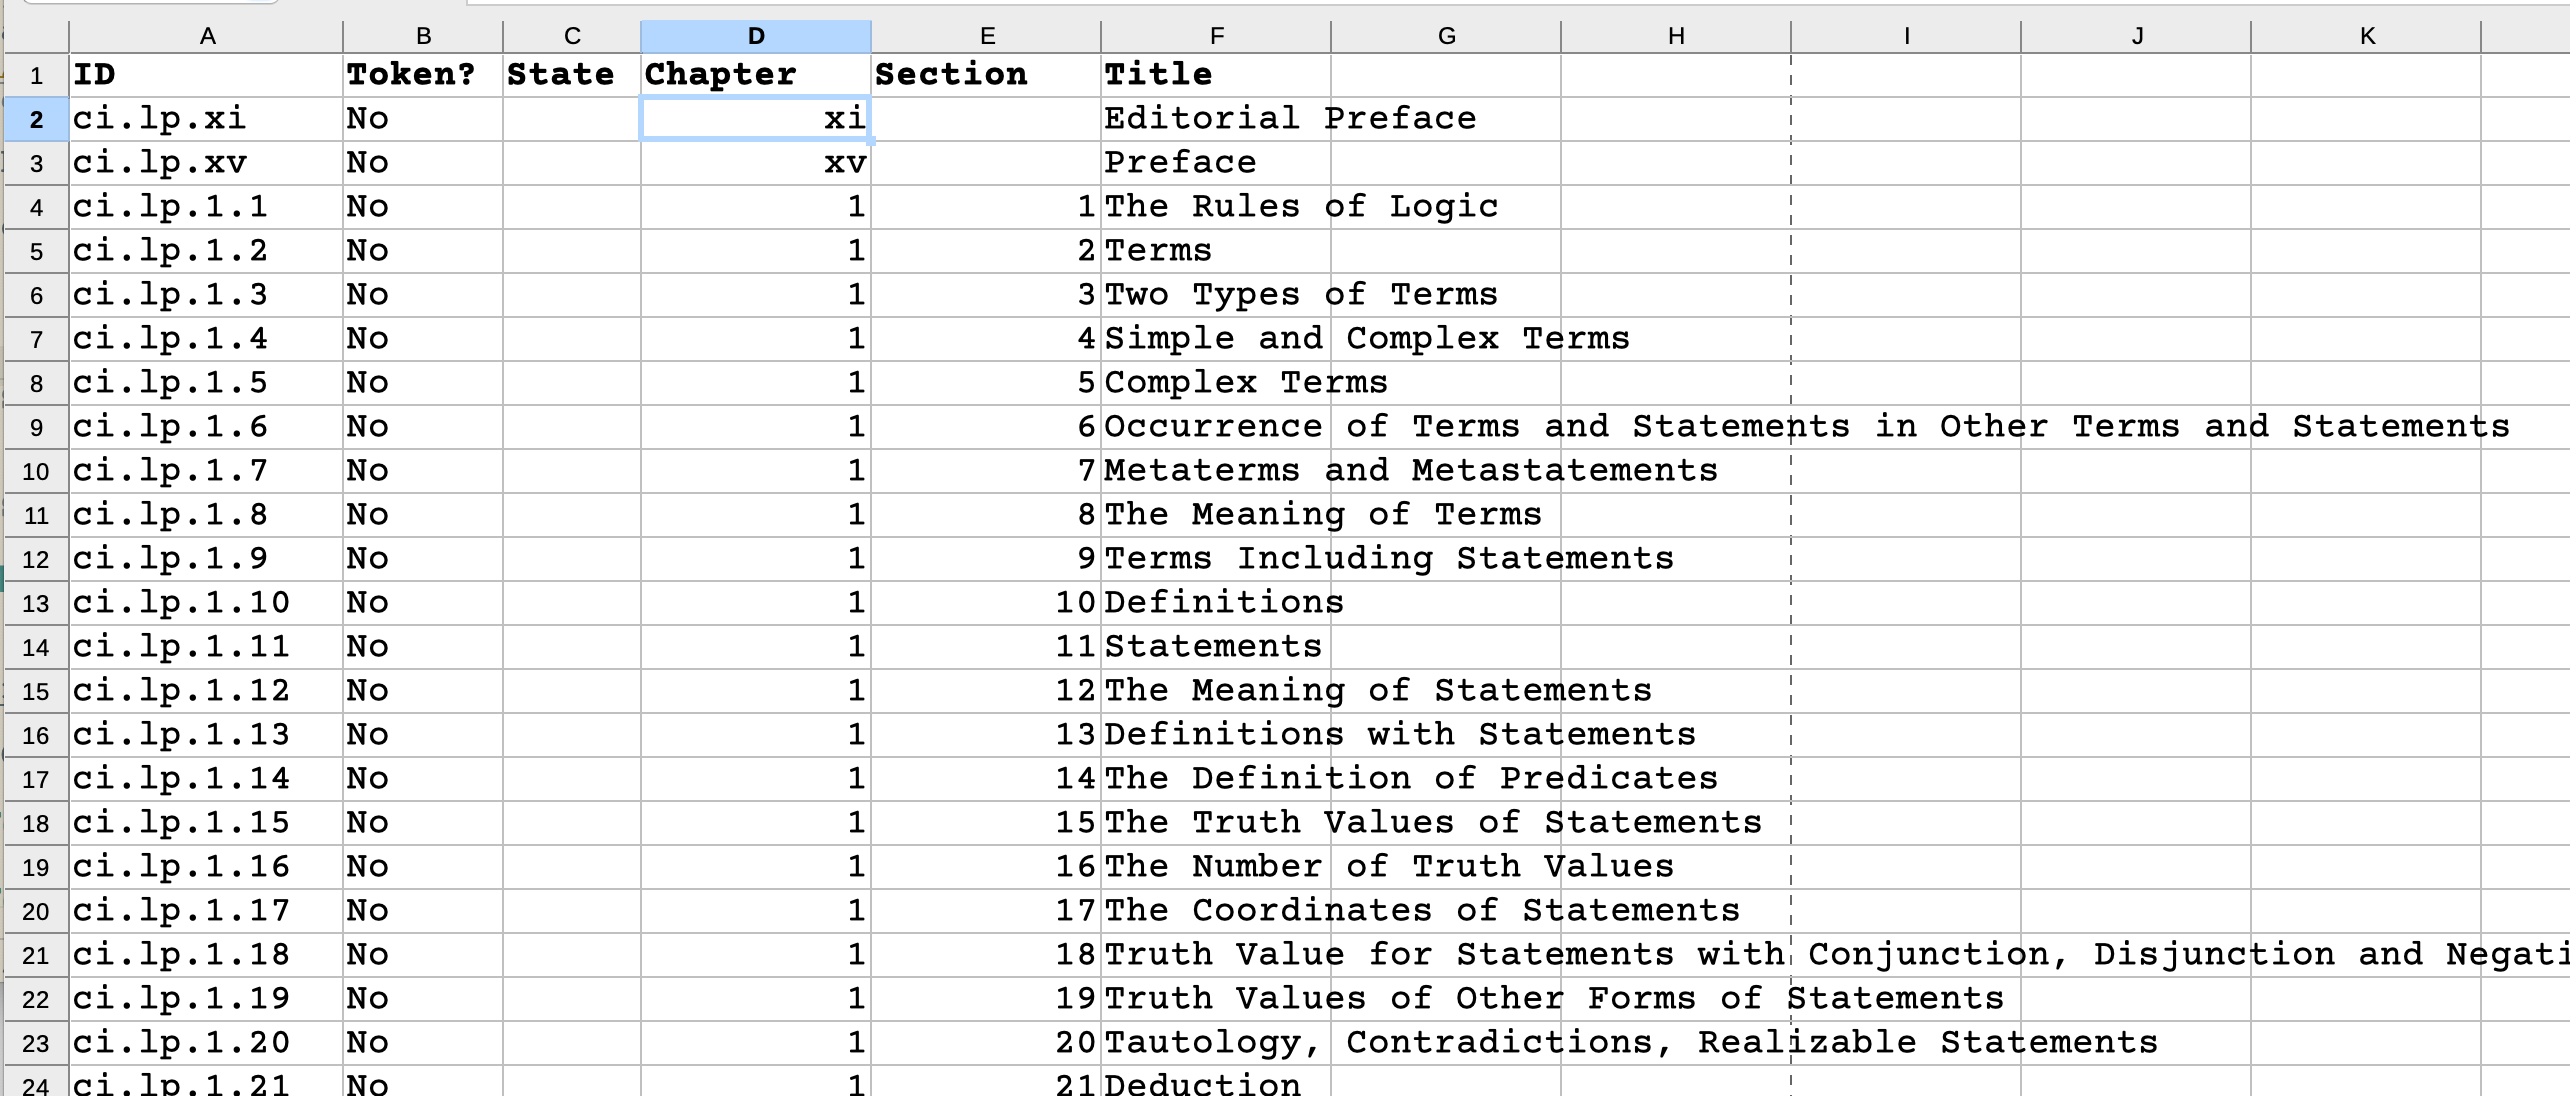
Sometimes it is not practical to represent the control state visually. Here is an example.
Imagine I want to read the book Logical Physics by Alexander Zinoviev and make sure I understand each section.
We could represent the control process like this:
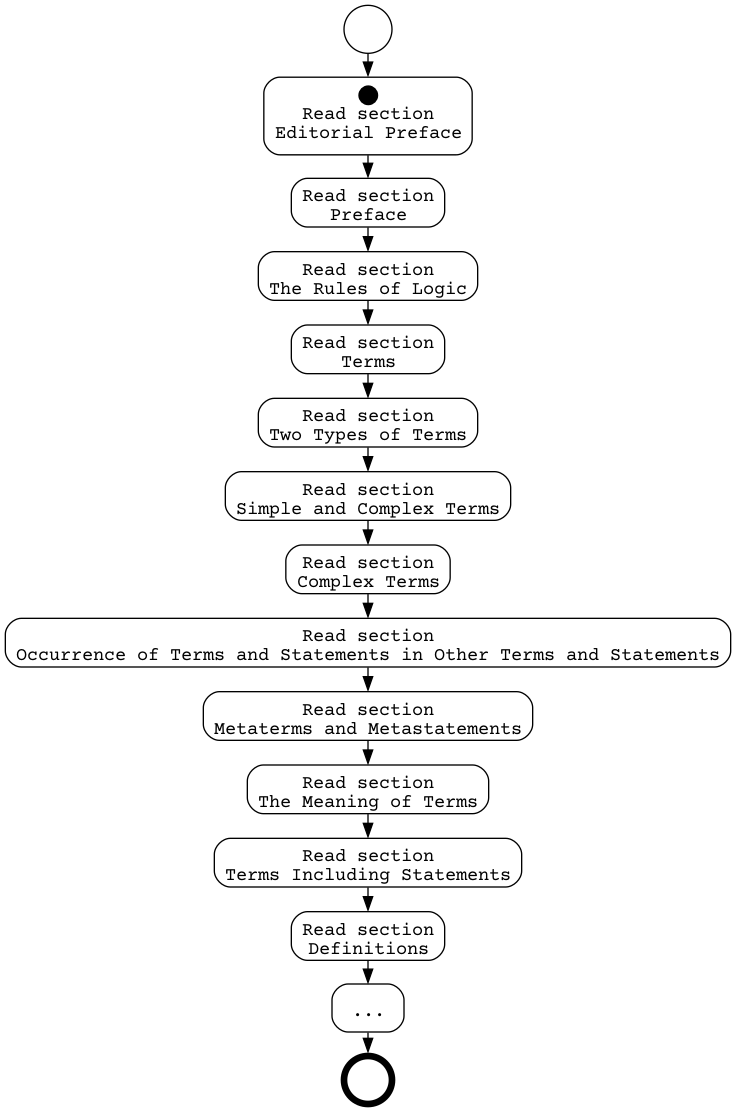
In this case, visualization doesn't serve its purpose (to make information easier to process).
Therefore, we can express the above diagram using a spreadsheet like the following.
2025-10-04